>Lets start with a data set of I evenly spaced points:

So we can calculate the standard deviation of any interval by iterating over that interval. Each interval is n and there are S total points that are that size element. Of couse we can relate n and i but for now just consider that there is are two indexes.
The averages are taken by summing over S. So we have a base interval size and we can increase the total interval size by increasing the number of intervals.

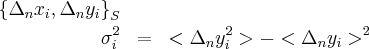
What happens qualitatively, the random walk causes the variance to increase with interval size, but eventually the interval size reduces the number of points signifigantly and we start to see decrease in variance with interval size.
Note the only thing I want to show with this graph is that the data is somewhat linear at small intervals. There are some effects from the random walk I use.
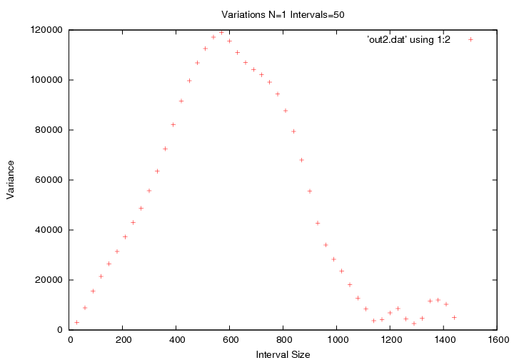
Now I want to consider what happens if I add more walkers. So Ill take the data from previous graph and use a lot of walkers. Then Ill calculate the variance in two methods.
The first method I will sum every interval over S and N completely ignoring the fact that they are from different walkers. That way the longest interval still has 200 points to samples, while the shortest... has a lot.
The second method involves finding the variance at each interval of a
walker, and then averaging that value over the number of walkers. I have included error bars, standard deviation.
This shows that my first graph held some truth. The rate the variance grows does decrease but this also shows when we need to be wary of our results once our interval get to about one seventh the size of the total interval we are seeing a significant spread and at about one third of the data set the error bars are larger than the data itself.
Also notice that the first method is much more accurate, because we are taking full advantage of N elements. Now Ill present one graph and show how the two methods change if I vary the measurement parameters.
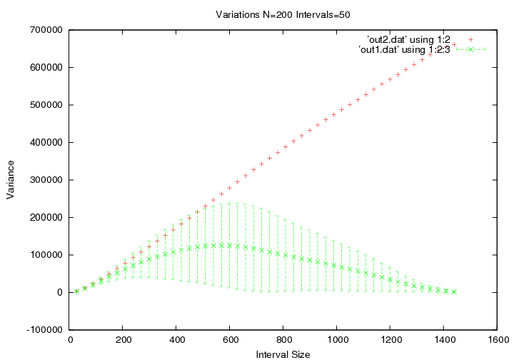
So I run walk and analyze the data with two different mothods as before, but I include multiple trials. (yes all of the indexing kills me too). With the output from every trial I least square fit them. The data with error bars gets a weighted fit.
I left off the error bars to show the behavior of the points. You can see. Now if I increase the number of walkers, The first method will increase in accurace, but I don't expect that from the second method.
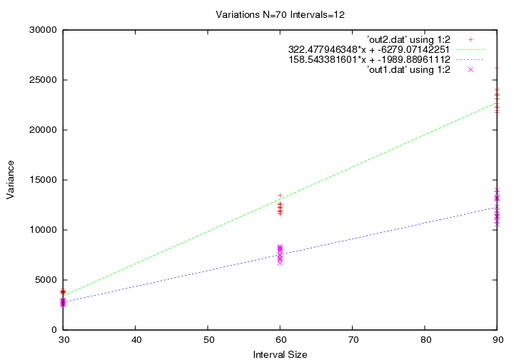
I mentioned before that my walk is special, and the first technique illustrates a kink. For short times the diffusivity is actually less than it is after a long time.
What I want to point out though is the tightening of the points.
Lastly I will increase the total interval size in this limit I expect the two data sets to coincide.
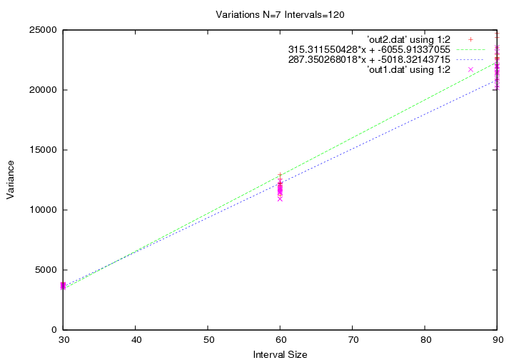
So thats it. I will use the first technique of averaging since it proved to be the most accurate. The actually diffusivity is half of the slope shown.