posted on: 2008-06-10 09:48:18
Here are some graphs to show the changes that occur when there is a higher probability of phosphate to be released at the tip.
>The first graph is a reproduction of steady state. cap length vs concentration.
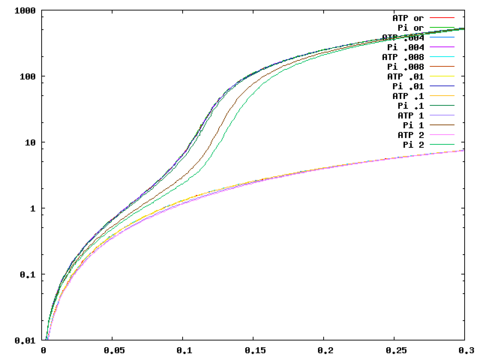
The trend is somewhat similar to what we might expect. The cap is shorter because the ADP depolymerizes quicker,. So the faster ADP Pi turns into ADP, the more depolymerization we have.
The next graph is the diffusivity as obtained through the std. deviation and time.
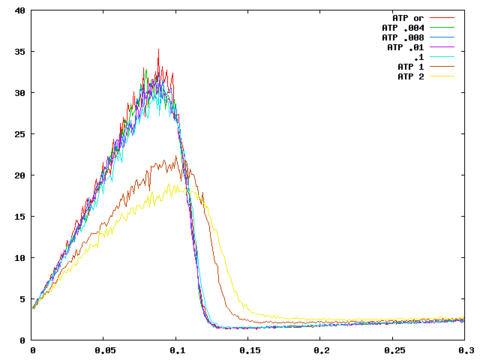
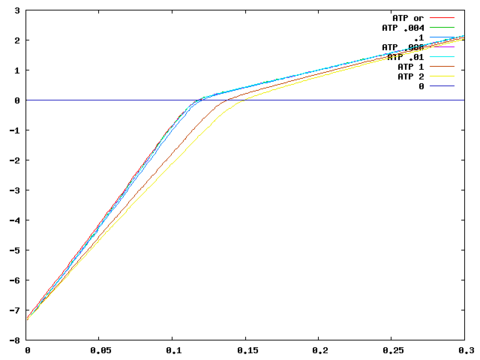
It seems reasonable that the peak fluctuations would be lower. The last graph suggests that the way the peak fluctuations has moved is due to a shift in critical concentration.
Comments
dimitris
2008-06-09 15:01:20
It does seem that fast Pi release from the tip does not modify the D(c) or j(c) curves at the barbed end qualitatively. There is a small shift in the critical concentration and a decrease in D below ccrit. The peak of D(c) remains below ccrit...
There has also been evidence fast Pi release at the pointed else. But its contribution to length fluctuations should be very small: the pointed end is much slower than the barbed end, and ADP-actin does not depolymerize fast at the pointed end.